
TPC’s metrics are objective in comparing, by numbers, systems running the standard set of queries against same size and distribution datasets. By those numbers, Cascade Engine showed outstanding performance.
This post drills further into TPC-H methodology to recover metrics with more practical meaning for BI system users such as the averages in query response speed of a TPC-H benchmarked analytic system and the cost of resources to support performance at larger data scales.
Business analysts care about speed and its sustainability when data size or number of concurrent sessions go up. They expect the analytic system to maintain its response speed at scale (“scalability”).
Note: BI analysts have yet another concern – the speed of an “ad-hoc” query, a query that has not been ran before and, no matter how well tuned up the query processing engine was, it could default into a full scan of the data, the slowest most expensive operation in terms of time and resource consumption.
The query processing speed of a system, although not a “primary metric”, is embedded in the performance test required by the TPC-H benchmark methodology.
The performance test consists of two runs of a well defined, representative set of queries, issued serially within each user session:
1. a "Power test", to measure the raw query execution power of the system when connected with a single active user.
2. a "Throughput test", to measure the ability of the system to process the most queries in the least amount of time, through two or more sessions, one session per
query stream and each stream must execute queries serially
(i.e., one after another).
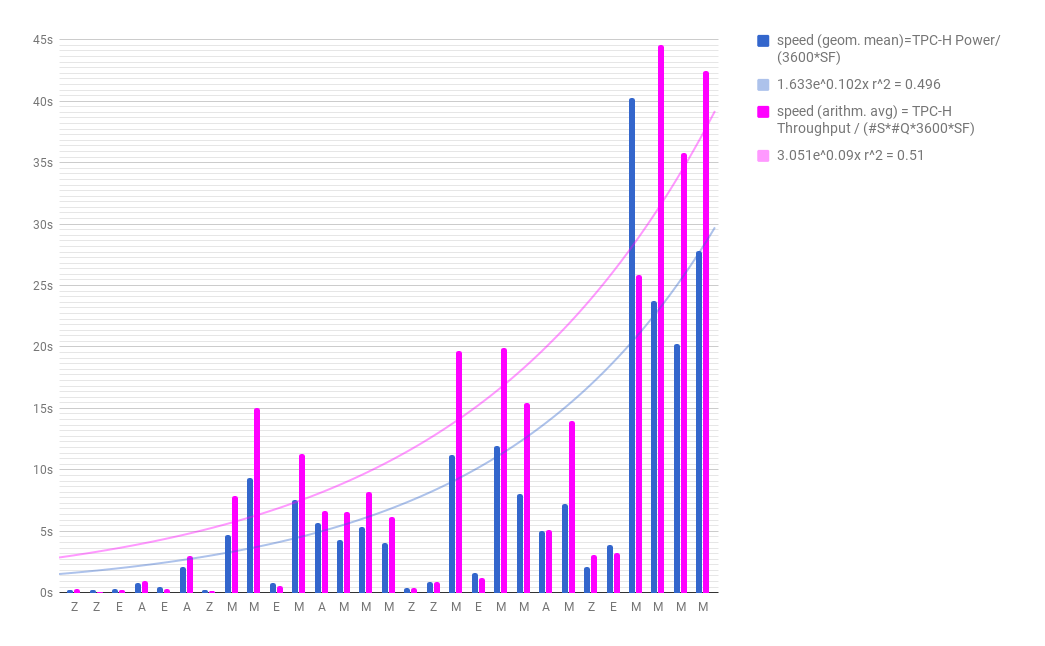
The geometrical mean of query execution time is expressed by TPC-H Power per hour@SF, a secondary metric. This mean is calculated as TPC-H Power/(3600*SF).
The calculated speed and the computing resources (memory and processing power) supporting it is tabulated below. Cascade System is compared against the same TPC-H – Top Ten Price/Performance Results Version 2 (Results As of 25-Aug-2017 at 6:00 AM [GMT] ), taking the top cluster and non-cluster performer at each Scale Factor. At one glance, for the Scale Factors at which it was benchmarked, Cascade Engine was twice faster using two-five times fewer computing resources, without even considering its data encoding and compression advantage for the amount of RAM needed to keep all data “in-memory”.
| Best results by TPC | Cascade Engine System | |||||||||
| SF (~GB size) | Database size(rows) | Cluster | Speed (sec.) |
Total RAM (GB) | Total #proc. |
Total #cores | Speed (sec.) |
Total RAM (GB) | Total #proc. | Total #cores |
| 100 | 600M | N | 0.78 | 64 | 2 | 16 | 0.2 | 64 | 1 | 8 |
| 100 | 600M | Y | 0.28 | 96 | 12 | 120 | 0.18 | 192 | 6 | 48 |
| 300 | 1.8B | N | 2.09 | 128 | 2 | 16 | * | * |
* | * |
| 300 | 1.8B | Y | 0.47 | 288 | 24 | 240 | 0.26 | 256 | 8 | 64 |
| 1000 | 6B | N | 4.09 | 512 | 2 | 44 | 0.87 | 960 | 2 | 20 |
| 1000 | 6B | Y | 0.82 | 640 | 40 | 400 | 0.4 | 384+ | 10 | 80 |
| 3000 | 18B | N | 5.02 | 3072 | 4 | 96 | 2.11 | 960+ | 2 | 20 |
| 3000 | 18B | Y | 1.59 | 1792 | 56 | 560 | * | * | * | * |
| 10000 | 60B | N | 20.27 | 6144 | 4 | 112 | * | * | * | * |
| 10000 | 60B | Y | 3.91 | 5440 | 68 | 680 | * | * | * | * |
| 30000 | 180B | N | 75.04 | 12800 | 8 | 144 | * | * | * | * |
| 30000 | 180B | Y | 10.31 | 12800 | 80 | 800 | * | * | * | * |
| 1000000 | 600B | N | _ | _ | * | * | * | * | ||
| 1000000 | 600B | Y | 30.63 | 38400 | 100 | 1000 | * | * | * | * |
+ RAM shortage caused some data to be stored on the disc; calculated “speed” could be higher
*The query processing speed (geom. mean) in the above table is calculated as TPC-H Power/(3600*SF) and expressed in s.  TPC-H benchmark methodology requires a "power" test, to measure the raw query "execution power" of the system when connected with a single active user. The result is the geometrical mean of query execution time expressed TPC-H Power per hour@SF, a secondary metric.
The other secondary metric is TPC-H Throughput, measured during throughput test. This metric's values demonstrate the ability of the system to process the most queries in the least amount of time. (performance). The arithmetic   SF*(S*22*3600)/TPC-H Throughput
In performance comparisons, geometrical means are a more objective representation of system capabilities than arithmetic means are.
The TPC believes that comparisons of TPC-H results measured against different database sizes are misleading and discourages such comparisons”.
TPC-H Composite Query-per-Hour Metric (QphH@Size) is the geometrica
As we “unbundled” the system speed from TPC-H metrics, it becomes clear that Cascade Engine’s outstanding performance is supported by substantially fewer hardware resources (CPU and RAM). These resources are also the most expensive components of a server unit, therefore, using fewer of them yields the “lowest cost of performance” benefit claimed by Zeepabyte.
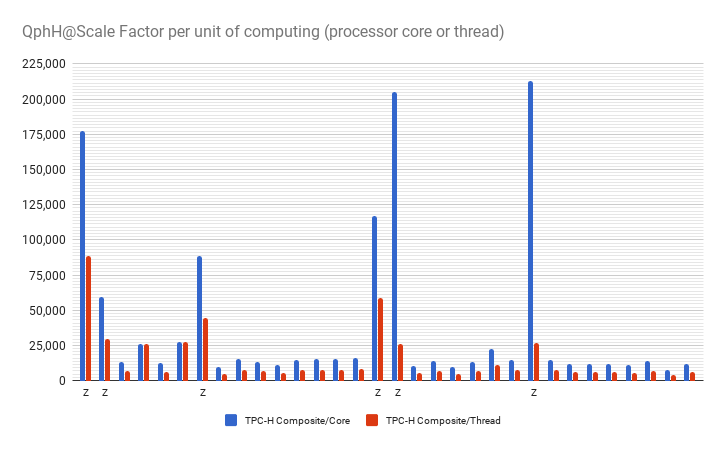
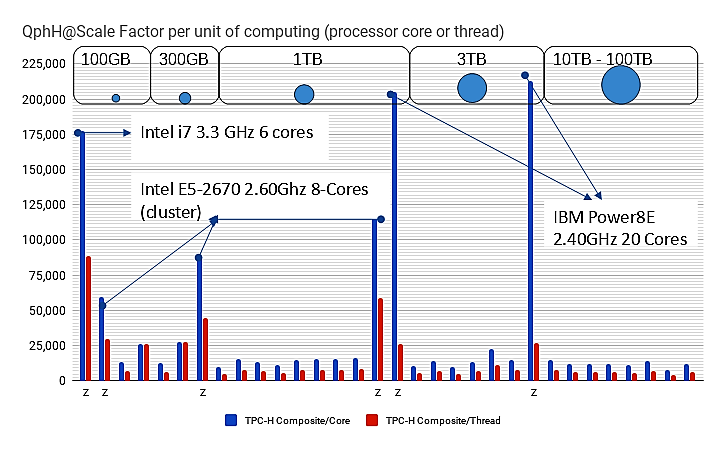
Each vendor participating in the TPC-H benchmark publishes the technical specifications of the hardware used. When plotting the TPC-H Composite Performance metric values “Query-per-Hour@Size” (equivalent Scale Factor) per unit of computation, either processor “core” or “thread”, Cascade Analytic System (Z) , demonstrates “sustainable scalability” with data volume and well-engineered multi-threaded implementation of its data search algorithm.
 Why does “sustainable scalability” matter?
When business analysts are asked to deliver faster reports from more data, the pressure raises on the mid-level management responsible for business technology to procure more “scalable” analytic solutions. Under tight implementation deadlines there is no time to drill into arcane benchmark results from various vendors to design “scalable solutions” for their own business. Half a century of conditioned IT thinking in “support systems”, pushes for expanding access to centralized DWHs by building smaller datawarehouses for each department, which then spawn hundreds of datamarts and thousands of OLAP cubes.
Not surprising, this is an uncanny way to temporarily solve the “scalability” problem, because each of these smaller systems can be expanded with additional storage and computing resources at their own level (and departmental expenses!) up to a point of diminishing returns, where (or when) most of them become slower and too expensive to expand year over year. That is the point when business analysts start complaining and new analytic system is procured. At the “overall supporting system” level this is just another island of temporary performance relief because the reality is a wider and wider “data swamp”.
Data processing in analytic systems is algorithmic, through software. On a large data set, software can process different parts of it independently, on multiple CPUs. Therefore it is important to distinguish “scalability” achived by adding a certain amount of resources to sustain some system performance parameters (e.g. TPC-H QphH@Size) from the efficient use of those computing resources (e.g. software implementations).
This idea is brilliantly explained in "Scalability - but at what COST?"  ,  a paper presented at HotOS 2015 conference by 3 ex-Microsoft researchers who work on distributed computing systems and data parallelism. They  surveyed measurements of data-parallel systems touting impressive scalability features, implemented their data processing algorithms  in single thread computing and reproduced the benchmark conditions to what degree are the "scalable" parallel implementations truly improve performance, as opposed to parallelizing overheads that they themselves introduce.
Defining "COST" of data processing with a given algorithm as the hardware
configuration required before the platform outperforms a competent
single-threaded implementation, they found that many systems have surprisingly large COST, that is they used hundreds of cores to match the single threaded implementation performance.
In a natural analogy, a well engineered analytics system shall behave like watermills: the water wheel works faster, it yields more power, when more water flows through; an additional wheel shall be engaged when the previous or proximal one reaches maximum speed.
Cascade Analytic System, benchmarked in both cluster and non-cluster configurations, has these natural characteristics, The following graph illustrates its behavior on 3 different type and generations of processors.
The next post will drill further into the benefits of efficient use of computation power translated into real cost advantage at very large data volumes and analytic workloads.
Stay tuned and do not forget to download and use the trial version of Cascade Engine!