
Zeepabyte’s solution datasheet as well as the recent PR with IBM Power Systems qualified the “three-fold benefit” of using Cascade Engine on different types of server infrastructure, clustered or not, on premises or on the cloud:
-
Groundbreaking performance
2-10x more queries per hour means higher productivity, that is: less wait time in business analysts’ schedule, more frequent insights from business operations data, faster detection of risks or intrusions
-
revolutionary low cost of performance
When such performance is achieved with 10-20 times fewer processor cores, not only the cost of infrastructure melts down, but a whole range of smaller devices become able to process data locally
-
drastically reduced energy costs
Extreme efficiency in using processor’s computing powers means more units of “useful analytics work” done by one CPU and leads to 50-80% savings in energy costs to power hardware infrastructure.
Let’s now back these claims with concrete numbers obtained following the trusted methodology of the Transactions Processing Council (TPC) as per their TPC-H benchmark specification.
The latest TPC Benchmark™ H – Decision Support – Standard Specification Revision 2.17.1 (June 2013) defines the following primary metrics:
The TPC-H Composite Query-per-Hour Metric (QphH@Size)
The price-performance metric is the TPC-H Price/Performance ($/QphH/@Size)
The Availability Date of the system ( when all system components are Generally Available.)
Note: No other TPC-H primary metric exist. Surprisingly, TPC_Energy metric defined as the power per performance (Watts/KQphH@Size) is optional.
The TPC-H Composite Query-per-Hour Metric expresses the overall performance of a complete and commercially available analytic system hardware and software. The reported values tend to be very large numbers because the specification mandates multiplication with the Scale Factor (SF) or "Size" of the test.  SF is a proxy for the test database size, expressed in GB (i.e., SF = 1 means approximately 1GB size for a test database). Most recent TPC-H Top 10 performance results are clustered in the SF range 1000-10000 that is test database sizes of 1TB-10TB, hence TPC-H  Composite Query-per-Hour Metric gets into hundreds of thousands and millions.

Note: The maximum size of the test database for a valid performance test is currently set at 100000 (i.e., SF = 100,000).
Vendors such as Dell, Cisco, HP, Lenovo, IBM, Exasol, Huawei, Actian, Microsoft, or Oracle, combine their hardware and analytic database software to compete for the highest performance of the overall system. Notwithstanding their own internal data organization, database vendors must report the same performance and cost metrics, for the same standardized set of complex business requests, against the same structured datasets containing the same number (from some millions to tens of billions) of rows of randomized and refreshed data..
Cascade Analytics System consistently proved better performance at any of the SF tested sofar and in partnership with different hardware vendors, with 2-3 times more queries per hour than the benchmark leaders, and lower cost, with almost 10 times lower price per unit of performance than these leaders.
| Scale Factor | TPC-H Composite Query-per-Hour Metric (QphH@Size) | TPC-H Price/Performance ($/QphH@Size) | ||||
| Database (~GB size) | Dataset size (rows) | Clustered servers | Best result by TPC | Cascade System* | Best results by TPC | Cascade System* |
| 100 | 600M | N | 420,092 | 1,416,786 | 0.11 | 0.01 |
| 100 | 600M | Y | 1,582,736 | 2,855,786 | 0.12 | 0.02 |
| 300 | 1.8B | N | 434,353 | * | 0.24 | * |
| 300 | 1.8B | Y | 2,948,721 | 5,683,743 | 0.12 | 0.02 |
| 1000 | 6B | N | 717,101 | 4,107,362 | 0.61 | 0.06 |
| 1000 | 6B | Y | 5,246,338 | 9,366,072 | 0.14 | 0.05 |
| 3000 | 18B | N | 2,140,307 | 4,262,032 | 0.38 | 0.09 |
| 3000 | 18B | Y | 7,808,386 | * | 0.15 | * |
| 10000 | 60B | N | 1,336,109 | * | 0.92 | * |
| 10000 | 60B | Y | 10,133,244 | * | 0.17 | * |
| 30000 | 180B | N | 1,056,164 | * | 2.04 | * |
| 30000 | 180B | Y | 11,223,614 | * | 0.23 | * |
| 1000000 | 600B | N | _ | * | _ | * |
| 1000000 | 600B | Y | 11,612,395 | * | 0.37 | * |
*Tests to benchmark at higher Scale Factors will occur as soon as opportunity presents itself and more infrastructure vendors enter in partnership for such tests.
"Any TPC-H result is comparable to other TPC-H results regardless of the number of query streams used during the test as long as the scale factors chosen for their respective test databases were the same."  (Clause 5.4.5.2 of TPC Benchmark™ H - Decision Support - Standard Specification Revision 2.17.1)
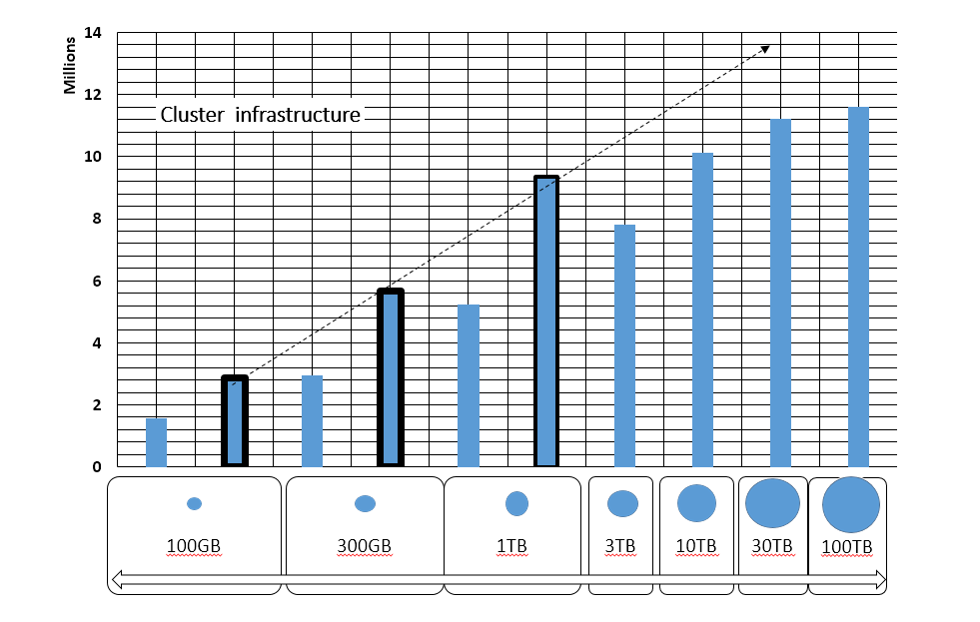
Following graphs show (bold shape) how Cascade Analytics Systems fared in comparison with TPC-H – Top Ten Price/Performance Results Version 2 Results As of 5-Aug-2017 at 3:06 AM [GMT] 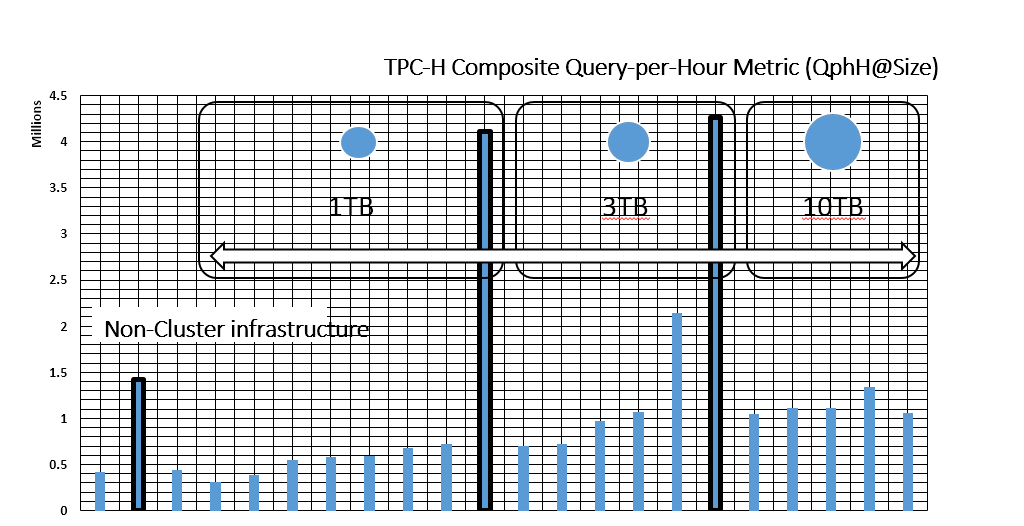
Most analytics systems participating in TPC-H benchmark are traditional non-clustered datacenter tower systems, increasing their resources by adding faster processors with more cores and larger sizes RAM.
However, cloudification, mobility and geographical distribution trends of IT infrastructure, increase demand for clustered and even elastic systems which scale out (on demand) by adding nodes to the managed computing infrastructure.
Cascade Engine outperforms by far other database vendors on non-clustered and gives signs of a healthy linear trend on clustered infrastructures (more to come on this behavior in next posts!)
These are very strong results! But they are not enough.
More practical questions must be answered in relationship with these results:
- How does “almost 10 million queries-per-hour against a 1TB TPC-H test compliant database” benefit business analysts? All they care about is that their reports must take less than a few seconds or, that when they run an ad-hoc query they are not automatically kicked-out of the DWH because the query takes too many IT resources, slowing down core business operation processes.
- Will we get the same breath-taking performance when I use Cascade Engine with my data on Hadoop or on other corporate approved hardware/software?
- Isn’t the extremely low cost-for-performance due to Cascade Analytic System using open source operating system or some deep discount of your software hard to detect in TPC-H’s complex formulae?
Let’s clarify from start: just like many other known DBMS providers, Cascade Analytics System, as benchmarked on TPC-H metrics, uses open source software components which are selected for their proven maturity, features performance, customer footprint and community support continuity. Cascade Engine is written in Java and deploys on open source Linux, sofar either Ubuntu or CentOS are used. Cluster operations of Cascade Analytic System are well supported by Apache HBase on top of Hadoop and HDFS and also by its own capabilities based on Apache Thrift RPC mechanism. However, Cascade Engine does not need a proprietary cluster Operating System or a heavy Database Management System (DBMS). Read all about Cascade architecture, functional components and core features on product documentation webpage.
Our customers and multiple trials demonstrated that while Cascade is using open source OS-es and software components, the secret sauce for Cascade Engine extreme performance in speed and cost is its patent pending data encoding and retrieval methods. The truth and proof will be discussed at length in these posts, with data collected from implementations of Cascade Analytic Systems on branded or unbranded servers but also on very cheap and ligh computing boards (see our results on Raspberry Pi2!),
With the TPC-H measured numbers in hand to show how much higher is the performance and how many times lower the price of that performance numbers, there is still a long way until the derived business benefits become clear to our customers and investors.
Why is that?
Data warehouse (DWH) practitioners do not work with metrics such as “Query-per-hour-@-datasize”. Most of them have knowledge about metrics such as :
(1) data size and its growth per day/month/year
(2) the number of queries business analysts need to run in one day
(3) the type of queries and the type and availability format of data sources
(4) for how long people or applications can wait for the analytics system to process certain types of queries.
They may also know business related constraints such as : (5) how fast the data is refreshed or (6) what is the upload time for daily new operational data into the analytics system. These two latter metrics become important as DWH operations must include optimizations for “big data” characteristics, particularly large volumes, variety and velocity, for example by organically growing a lower cost Hadoop environment as part of its branded Database Management Systems (DBMS) infrastructure (see an interesting DWH Cost Saving Calculator)
How many vendors connected their highly touted TPC-H performance results with these practical attributes of DWH analytic systems? Most technical marketing materials of large analytic systems vendors build on use-cases: problems, solutions based on the technology and the cost -benefit of the solution. Fetching a similar use-case out of a large portfolio is vendor’s best bet against the risk of getting a prospect customer confused by the metrics of TPC-H benchmark!
But is this handy similarity – and our very human characteristic of learning and judging by analogy – still valid at “large scale” (or large numbers)? Even experts of a domain have difficulties when thinking in very large numbers/sizes or making projections at very distant times. Extrapolation using simple linear models, those which built the foundation of business management (in static economic environment) as well as of semiconductor electronics (amplifying small signals around gate’s opening voltage), fails at large scale inputs.
“Making decisions about the performance characteristics of a big data analytics system based on use-case analogy is extremely error prone. Making purchase decisions without understanding the nature of all sources of costs in the analytic system, is suicidal.“
Using TPC-H benchmark only for the greatness of its primary metrics and without revealing which system’s characteristics support and sustain performance at larger and larger datasizes, is a missed opportunity. The next posts will explain how to translate these metrics into real data analytics business metrics and give concrete answers to DWH practitioners’ questions.
Stay tuned and do not forget to download and use the trial version of Cascade Engine!
One Reply to “Using TPC-H metrics to explain the three-fold benefit of Cascade Analytics System (I)”